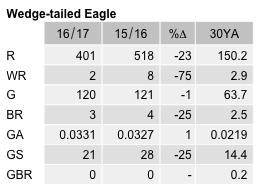
Wedge-tailed Eagle
Aquila audax
ABR description
The following is extracted from the Annual Bird Report for the twelve months to June 2017.
Aquila audax 252 Common, breeding resident
A large conspicuous raptor regularly seen soaring over woodlands and open country, and sometimes over the suburbs.
General: The iconic “wedgie” is one of the very few raptor success stories in our region, with 429 records this year, from 124 widespread grid cells. The relatively healthy reporting rate of 3.0% is nevertheless well below the 30YA of 5.5%. Numbers ranged from 1-7 birds (7/23 Mar Warriwillah GrL23 (EmD1); average 1.5, median 1. Recorded in every week and fairly evenly throughout the year. June was the top month for wedgie observations, with records from over a third of all grid cells for which records were entered. There were 5 breeding records, from br/14 Oct Lower Molonglo GrK13 (CnM1) to br/18 May Jerrabomberra GrL15 (CnM1). Additional breeding reported by Olsen (2017), on the COG chat line and elsewhere was not reflected in the formal record.
GBS: There were fewer garden bird records this year, at 66, but the reporting rate of 2.6% compared more than favourably with the 30YA of 1.6%. Range 1-3 birds. Records came from 21 widespread sites, both urban and rural, over 42 weeks, with a slight peak in autumn 35% of records. No breeding ever recorded in the GBS.
Abundance
Abundance is the average number of birds of that species per survey. Where the species was observed (presence recorded) but the number of birds seen was not recorded, this is treated as a count of zero.
Abundance by year
This chart shows the abundance of Wedge-tailed Eagle between 1982 and 2017. 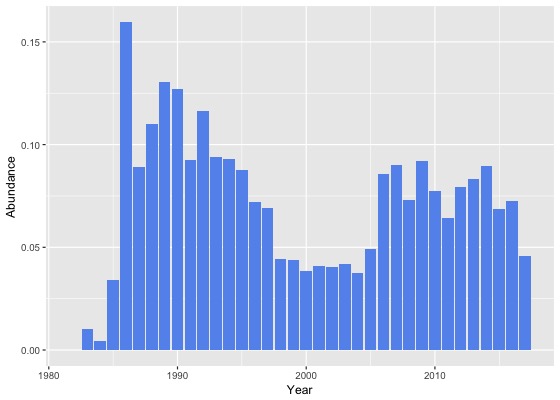
Abundance by month
This chart shows the monthly abundance of Wedge-tailed Eagle. The blue lines show the abundance for the twelve months to June 2017 and the bars show the average abundance for the period 1982 to 2017. 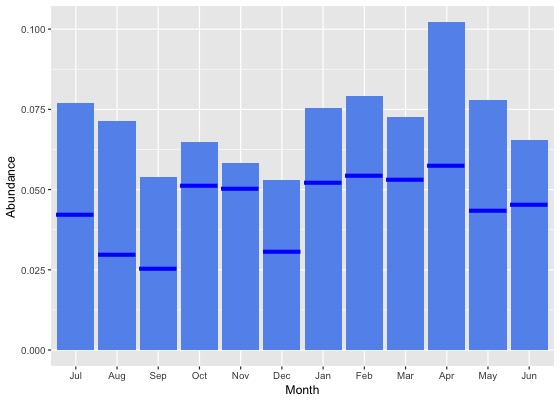
Abundance by season
This chart shows the seasonal abundance of Wedge-tailed Eagle. The blue lines show the seasonal abundance for the twelve months to June 2017 and the bars show the average seasonal abundance for the period 1982 to 2017. 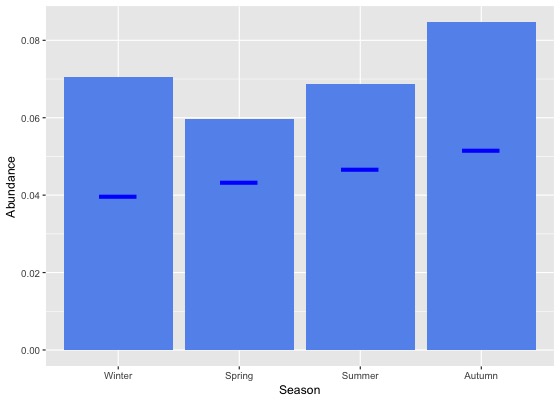
Abundance data
| Month | Season | ||||||||||||||||||
|---|---|---|---|---|---|---|---|---|---|---|---|---|---|---|---|---|---|---|---|
| Period | Jul | Aug | Sep | Oct | Nov | Dec | Jan | Feb | Mar | Apr | May | Jun | Winter | Spring | Summer | Autumn | All | ||
| All years | |||||||||||||||||||
| All | 0.1 | 0.1 | 0.1 | 0.1 | 0.1 | 0.1 | 0.1 | 0.1 | 0.1 | 0.1 | 0.1 | 0.1 | 0.1 | 0.1 | 0.1 | 0.1 | 0.1 | ||
| Previous years | |||||||||||||||||||
| All previous years | 0.1 | 0.1 | 0.1 | 0.1 | 0.1 | 0.1 | 0.1 | 0.1 | 0.1 | 0.1 | 0.1 | 0.1 | 0.1 | 0.1 | 0.1 | 0.1 | 0.1 | ||
| Previous 30 years | 0.1 | 0.1 | 0.1 | 0.1 | 0.1 | 0.1 | 0.1 | 0.1 | 0.1 | 0.1 | 0.1 | 0.1 | 0.1 | 0.1 | 0.1 | 0.1 | 0.1 | ||
| Previous 20 years | 0.1 | 0.1 | 0.1 | 0.1 | 0.1 | 0.1 | 0.1 | 0.1 | 0.1 | 0.1 | 0.1 | 0.1 | 0.1 | 0.1 | 0.1 | 0.1 | 0.1 | ||
| 10 year groups | |||||||||||||||||||
| [2007,2017) | 0.1 | 0.1 | 0.1 | 0.1 | 0.1 | 0.1 | 0.1 | 0.1 | 0.1 | 0.1 | 0.1 | 0.1 | 0.1 | 0.1 | 0.1 | 0.1 | 0.1 | ||
| [1997,2007) | 0.0 | 0.1 | 0.0 | 0.0 | 0.0 | 0.0 | 0.1 | 0.1 | 0.1 | 0.1 | 0.1 | 0.0 | 0.0 | 0.0 | 0.0 | 0.1 | 0.0 | ||
| [1987,1997) | 0.1 | 0.1 | 0.1 | 0.1 | 0.1 | 0.1 | 0.1 | 0.1 | 0.1 | 0.1 | 0.1 | 0.1 | 0.1 | 0.1 | 0.1 | 0.1 | 0.1 | ||
| 5 year groups | |||||||||||||||||||
| [2012,2017) | 0.1 | 0.1 | 0.1 | 0.1 | 0.1 | 0.1 | 0.1 | 0.1 | 0.1 | 0.1 | 0.1 | 0.1 | 0.1 | 0.1 | 0.1 | 0.1 | 0.1 | ||
| [2007,2012) | 0.1 | 0.1 | 0.1 | 0.1 | 0.1 | 0.0 | 0.1 | 0.1 | 0.1 | 0.1 | 0.1 | 0.1 | 0.1 | 0.1 | 0.1 | 0.1 | 0.1 | ||
| [2002,2007) | 0.1 | 0.0 | 0.0 | 0.1 | 0.0 | 0.0 | 0.0 | 0.1 | 0.1 | 0.1 | 0.1 | 0.0 | 0.0 | 0.0 | 0.0 | 0.1 | 0.1 | ||
| [1997,2002) | 0.0 | 0.1 | 0.0 | 0.0 | 0.0 | 0.0 | 0.1 | 0.1 | 0.1 | 0.0 | 0.1 | 0.0 | 0.0 | 0.0 | 0.0 | 0.1 | 0.0 | ||
| [1992,1997) | 0.1 | 0.1 | 0.1 | 0.1 | 0.1 | 0.1 | 0.1 | 0.1 | 0.1 | 0.1 | 0.1 | 0.1 | 0.1 | 0.1 | 0.1 | 0.1 | 0.1 | ||
| [1987,1992) | 0.1 | 0.1 | 0.1 | 0.1 | 0.1 | 0.1 | 0.1 | 0.1 | 0.1 | 0.1 | 0.1 | 0.1 | 0.1 | 0.1 | 0.1 | 0.1 | 0.1 | ||
| Year | |||||||||||||||||||
| 2017 | 0.0 | 0.0 | 0.0 | 0.1 | 0.1 | 0.0 | 0.1 | 0.1 | 0.1 | 0.1 | 0.0 | 0.0 | 0.0 | 0.0 | 0.0 | 0.1 | 0.0 | ||
| 2016 | 0.1 | 0.1 | 0.1 | 0.1 | 0.1 | 0.1 | 0.1 | 0.1 | 0.1 | 0.1 | 0.1 | 0.1 | 0.1 | 0.1 | 0.1 | 0.1 | 0.1 | ||
| 2015 | 0.1 | 0.1 | 0.1 | 0.1 | 0.1 | 0.0 | 0.1 | 0.1 | 0.1 | 0.1 | 0.1 | 0.1 | 0.1 | 0.1 | 0.1 | 0.1 | 0.1 | ||
| 2014 | 0.1 | 0.1 | 0.1 | 0.1 | 0.1 | 0.1 | 0.1 | 0.1 | 0.1 | 0.2 | 0.1 | 0.1 | 0.1 | 0.1 | 0.1 | 0.1 | 0.1 | ||
| 2013 | 0.1 | 0.1 | 0.0 | 0.1 | 0.1 | 0.1 | 0.1 | 0.1 | 0.1 | 0.2 | 0.1 | 0.1 | 0.1 | 0.1 | 0.1 | 0.1 | 0.1 | ||
| 2012 | 0.1 | 0.1 | 0.1 | 0.1 | 0.0 | 0.1 | 0.1 | 0.2 | 0.1 | 0.1 | 0.1 | 0.1 | 0.1 | 0.1 | 0.1 | 0.1 | 0.1 | ||
| 2011 | 0.1 | 0.0 | 0.0 | 0.1 | 0.0 | 0.0 | 0.1 | 0.1 | 0.0 | 0.1 | 0.1 | 0.1 | 0.1 | 0.1 | 0.1 | 0.1 | 0.1 | ||
| 2010 | 0.2 | 0.1 | 0.0 | 0.1 | 0.1 | 0.1 | 0.1 | 0.1 | 0.0 | 0.1 | 0.1 | 0.1 | 0.1 | 0.1 | 0.1 | 0.1 | 0.1 | ||
| 2009 | 0.1 | 0.1 | 0.1 | 0.1 | 0.1 | 0.1 | 0.0 | 0.2 | 0.2 | 0.1 | 0.2 | 0.1 | 0.1 | 0.1 | 0.1 | 0.1 | 0.1 | ||
| 2008 | 0.1 | 0.1 | 0.1 | 0.1 | 0.1 | 0.1 | 0.1 | 0.1 | 0.0 | 0.1 | 0.1 | 0.1 | 0.1 | 0.1 | 0.1 | 0.1 | 0.1 | ||
| 2007 | 0.0 | 0.1 | 0.0 | 0.1 | 0.1 | 0.0 | 0.1 | 0.1 | 0.1 | 0.1 | 0.2 | 0.1 | 0.1 | 0.1 | 0.1 | 0.1 | 0.1 | ||
| 2006 | 0.1 | 0.1 | 0.0 | 0.1 | 0.1 | 0.1 | 0.1 | 0.0 | 0.1 | 0.2 | 0.0 | 0.0 | 0.1 | 0.1 | 0.1 | 0.1 | 0.1 | ||
| 2005 | 0.1 | 0.0 | 0.0 | 0.0 | 0.1 | 0.0 | 0.0 | 0.2 | 0.1 | 0.1 | 0.1 | 0.1 | 0.1 | 0.0 | 0.1 | 0.1 | 0.0 | ||
| 2004 | 0.0 | 0.0 | 0.0 | 0.0 | 0.0 | 0.0 | 0.0 | 0.0 | 0.0 | 0.1 | 0.1 | 0.1 | 0.0 | 0.0 | 0.0 | 0.1 | 0.0 | ||
| 2003 | 0.1 | 0.0 | 0.0 | 0.0 | 0.0 | 0.0 | 0.0 | 0.0 | 0.0 | 0.2 | 0.1 | 0.0 | 0.0 | 0.0 | 0.0 | 0.1 | 0.0 | ||
| 2002 | 0.1 | 0.0 | 0.0 | 0.0 | 0.0 | 0.0 | 0.1 | 0.1 | 0.0 | 0.0 | 0.0 | 0.1 | 0.1 | 0.0 | 0.1 | 0.0 | 0.0 | ||
| 2001 | 0.0 | 0.0 | 0.0 | 0.0 | 0.0 | 0.0 | 0.0 | 0.1 | 0.0 | 0.1 | 0.1 | 0.0 | 0.0 | 0.0 | 0.0 | 0.1 | 0.0 | ||
| 2000 | 0.0 | 0.1 | 0.0 | 0.0 | 0.0 | 0.0 | 0.0 | 0.0 | 0.1 | 0.0 | 0.0 | 0.0 | 0.1 | 0.0 | 0.0 | 0.1 | 0.0 | ||
| 1999 | 0.0 | 0.1 | 0.1 | 0.1 | 0.0 | 0.0 | 0.1 | 0.1 | 0.0 | 0.0 | 0.0 | 0.0 | 0.0 | 0.1 | 0.1 | 0.0 | 0.0 | ||
| 1998 | 0.0 | 0.1 | 0.0 | 0.0 | 0.0 | 0.1 | 0.1 | 0.0 | 0.0 | 0.0 | 0.0 | 0.0 | 0.0 | 0.0 | 0.1 | 0.0 | 0.0 | ||
| 1997 | 0.1 | 0.0 | 0.1 | 0.0 | 0.0 | 0.0 | 0.2 | 0.1 | 0.2 | 0.1 | 0.0 | 0.0 | 0.0 | 0.0 | 0.1 | 0.1 | 0.1 | ||
| 1996 | 0.0 | 0.0 | 0.0 | 0.0 | 0.0 | 0.1 | 0.1 | 0.1 | 0.1 | 0.1 | 0.1 | 0.1 | 0.1 | 0.0 | 0.1 | 0.1 | 0.1 | ||
| 1995 | 0.2 | 0.1 | 0.1 | 0.1 | 0.0 | 0.1 | 0.2 | 0.1 | 0.1 | 0.1 | 0.0 | 0.0 | 0.1 | 0.1 | 0.1 | 0.1 | 0.1 | ||
| 1994 | 0.1 | 0.2 | 0.1 | 0.0 | 0.0 | 0.1 | 0.1 | 0.1 | 0.1 | 0.1 | 0.2 | 0.0 | 0.1 | 0.1 | 0.1 | 0.1 | 0.1 | ||
| 1993 | 0.1 | 0.1 | 0.1 | 0.0 | 0.0 | 0.1 | 0.3 | 0.0 | 0.1 | 0.2 | 0.1 | 0.1 | 0.1 | 0.1 | 0.1 | 0.1 | 0.1 | ||
| 1992 | 0.1 | 0.0 | 0.1 | 0.1 | 0.2 | 0.1 | 0.1 | 0.3 | 0.2 | 0.2 | 0.1 | 0.0 | 0.1 | 0.1 | 0.1 | 0.2 | 0.1 | ||
| 1991 | 0.0 | 0.1 | 0.0 | 0.0 | 0.2 | 0.1 | 0.1 | 0.1 | 0.2 | 0.2 | 0.2 | 0.2 | 0.1 | 0.1 | 0.1 | 0.2 | 0.1 | ||
| 1990 | 0.2 | 0.1 | 0.1 | 0.1 | 0.1 | 0.2 | 0.1 | 0.0 | 0.3 | 0.2 | 0.2 | 0.1 | 0.1 | 0.1 | 0.1 | 0.2 | 0.1 | ||
| 1989 | 0.2 | 0.1 | 0.1 | 0.1 | 0.1 | 0.1 | 0.1 | 0.1 | 0.1 | 0.1 | 0.2 | 0.1 | 0.1 | 0.1 | 0.1 | 0.1 | 0.1 | ||
| 1988 | 0.1 | 0.1 | 0.1 | 0.1 | 0.1 | 0.1 | 0.1 | 0.2 | 0.1 | 0.1 | 0.1 | 0.1 | 0.1 | 0.1 | 0.1 | 0.1 | 0.1 | ||
| 1987 | 0.0 | 0.1 | 0.1 | 0.1 | 0.1 | 0.0 | 0.1 | 0.1 | 0.1 | 0.1 | 0.1 | 0.1 | 0.1 | 0.1 | 0.1 | 0.1 | 0.1 | ||
| 1986 | 0.1 | 0.0 | 0.1 | 0.1 | 0.1 | 0.1 | 0.2 | 0.1 | 0.1 | 0.6 | 0.2 | 0.1 | 0.1 | 0.1 | 0.1 | 0.4 | 0.2 | ||
| 1985 | 0.0 | 0.0 | 0.0 | 0.0 | 0.0 | 0.0 | 0.2 | 0.1 | 0.1 | 0.1 | 0.0 | 0.1 | 0.0 | 0.0 | 0.0 | 0.0 | 0.0 | ||
| 1984 | 0.0 | 0.0 | 0.2 | 0.0 | 0.0 | 0.0 | 0.0 | 0.0 | 0.0 | 0.0 | 0.0 | 0.0 | 0.0 | 0.0 | 0.0 | 0.0 | 0.0 | ||
| 1983 | 0.0 | 0.0 | 0.0 | 0.1 | 0.0 | 0.0 | 0.0 | 0.0 | 0.0 | - | 0.0 | 0.0 | 0.0 | 0.0 | 0.0 | 0.0 | 0.0 | ||
| 1982 | - | 0.0 | - | 0.0 | 0.0 | 0.0 | - | 0.0 | - | 0.0 | - | 0.0 | 0.0 | 0.0 | 0.0 | 0.0 | 0.0 | ||
Reporting rates
Reporting rate is the proportion of all surveys in which the species was present.
Reporting rate by year
This chart shows the reporting rate of Wedge-tailed Eagle each year between 1982 and 2017. 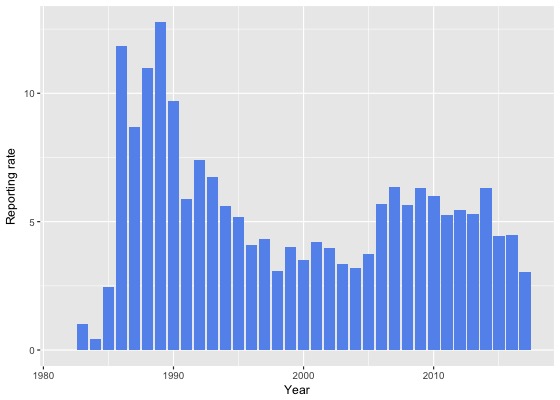
Reporting rate by month
This chart shows the reporting rate by month of Wedge-tailed Eagle. The blue lines show the reporting rate for the twelve months to June 2017 and the bars show the average reporting rate for the period 1982 to 2017. 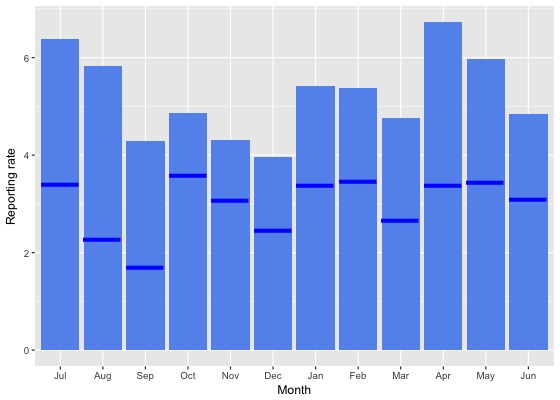
Reporting rate by season
This chart shows the seasonal reporting rate of Wedge-tailed Eagle. The blue lines show the seasonal reporting rate for the twelve months to June 2017 and the bars show the average seasonal reporting rate for the period 1982 to 2017. 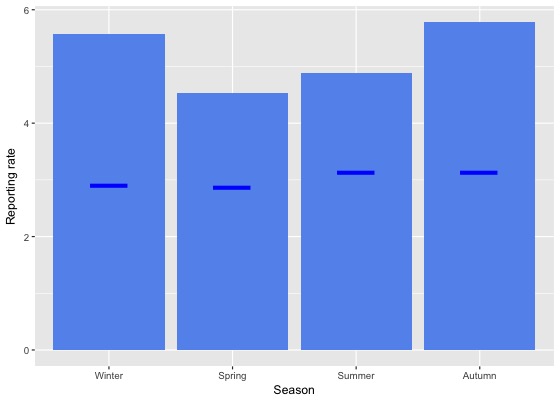
Reporting rate data
| Month | Season | ||||||||||||||||||
|---|---|---|---|---|---|---|---|---|---|---|---|---|---|---|---|---|---|---|---|
| Period | Jul | Aug | Sep | Oct | Nov | Dec | Jan | Feb | Mar | Apr | May | Jun | Winter | Spring | Summer | Autumn | All | ||
| All years | |||||||||||||||||||
| All | 6.4 | 5.8 | 4.3 | 4.9 | 4.3 | 4.0 | 5.4 | 5.4 | 4.8 | 6.7 | 6.0 | 4.8 | 5.6 | 4.5 | 4.9 | 5.8 | 5.2 | ||
| Previous years | |||||||||||||||||||
| All previous years | 6.8 | 6.5 | 4.7 | 5.0 | 4.5 | 4.2 | 5.8 | 5.8 | 5.1 | 7.3 | 6.6 | 5.2 | 6.1 | 4.8 | 5.2 | 6.3 | 5.5 | ||
| Previous 30 years | 6.9 | 6.6 | 4.7 | 5.1 | 4.5 | 4.2 | 5.8 | 5.8 | 5.1 | 7.2 | 6.5 | 5.2 | 6.1 | 4.8 | 5.2 | 6.2 | 5.5 | ||
| Previous 20 years | 5.7 | 5.7 | 3.9 | 4.7 | 4.0 | 3.7 | 5.2 | 5.1 | 4.3 | 6.5 | 6.0 | 4.6 | 5.2 | 4.3 | 4.6 | 5.5 | 4.9 | ||
| 10 year groups | |||||||||||||||||||
| [2007,2017) | 6.1 | 6.3 | 4.1 | 5.0 | 4.5 | 4.1 | 5.5 | 5.4 | 4.2 | 6.8 | 6.4 | 5.3 | 5.8 | 4.6 | 5.0 | 5.7 | 5.2 | ||
| [1997,2007) | 4.8 | 4.4 | 3.5 | 3.5 | 3.0 | 3.0 | 4.1 | 4.4 | 4.3 | 5.6 | 5.0 | 3.0 | 4.0 | 3.3 | 3.7 | 4.9 | 4.0 | ||
| [1987,1997) | 11.1 | 9.4 | 8.6 | 7.2 | 6.2 | 7.0 | 9.4 | 9.2 | 10.0 | 10.5 | 8.6 | 8.1 | 9.5 | 7.2 | 8.5 | 9.7 | 8.7 | ||
| 5 year groups | |||||||||||||||||||
| [2012,2017) | 5.5 | 5.9 | 3.9 | 4.9 | 4.2 | 4.5 | 5.2 | 4.6 | 4.2 | 6.6 | 5.4 | 5.1 | 5.5 | 4.4 | 4.8 | 5.4 | 5.0 | ||
| [2007,2012) | 7.9 | 7.9 | 4.5 | 5.2 | 5.1 | 3.3 | 6.6 | 8.8 | 4.5 | 7.3 | 9.3 | 5.7 | 6.7 | 5.0 | 5.7 | 6.7 | 5.9 | ||
| [2002,2007) | 5.6 | 4.4 | 2.8 | 4.2 | 2.8 | 2.9 | 3.7 | 4.1 | 4.3 | 6.5 | 4.6 | 3.4 | 4.4 | 3.3 | 3.5 | 5.1 | 4.0 | ||
| [1997,2002) | 3.5 | 4.4 | 4.4 | 2.4 | 3.2 | 3.1 | 4.6 | 4.7 | 4.4 | 4.5 | 5.5 | 2.5 | 3.4 | 3.4 | 4.0 | 4.7 | 3.9 | ||
| [1992,1997) | 7.4 | 5.1 | 5.3 | 3.8 | 4.1 | 4.4 | 9.2 | 6.8 | 6.8 | 7.8 | 4.6 | 3.5 | 5.2 | 4.3 | 6.9 | 6.5 | 5.6 | ||
| [1987,1992) | 12.8 | 11.7 | 10.2 | 9.0 | 7.2 | 8.2 | 9.4 | 10.1 | 11.9 | 12.1 | 10.7 | 10.6 | 11.7 | 8.7 | 9.2 | 11.6 | 10.2 | ||
| Year | |||||||||||||||||||
| 2017 | 3.4 | 2.3 | 1.7 | 3.6 | 3.1 | 2.5 | 3.4 | 3.5 | 2.7 | 3.4 | 3.5 | 3.1 | 2.9 | 2.9 | 3.1 | 3.1 | 3.0 | ||
| 2016 | 5.8 | 6.1 | 3.8 | 4.3 | 4.2 | 3.2 | 4.1 | 4.3 | 4.0 | 5.3 | 4.9 | 4.2 | 5.4 | 4.1 | 3.9 | 4.7 | 4.5 | ||
| 2015 | 4.2 | 4.5 | 4.4 | 4.0 | 3.8 | 3.5 | 5.2 | 3.3 | 3.8 | 6.2 | 5.3 | 5.1 | 4.7 | 4.1 | 4.1 | 5.1 | 4.4 | ||
| 2014 | 6.1 | 6.7 | 4.2 | 5.5 | 7.4 | 5.7 | 8.0 | 6.3 | 4.6 | 9.5 | 6.6 | 5.2 | 5.9 | 5.5 | 7.0 | 6.7 | 6.3 | ||
| 2013 | 4.1 | 5.9 | 2.9 | 6.3 | 5.1 | 5.2 | 4.2 | 4.7 | 4.6 | 8.8 | 7.1 | 4.7 | 4.9 | 5.0 | 4.7 | 6.6 | 5.3 | ||
| 2012 | 7.9 | 6.7 | 3.7 | 5.5 | 1.6 | 7.5 | 4.8 | 7.3 | 4.5 | 6.3 | 4.3 | 7.2 | 7.3 | 4.1 | 6.1 | 5.2 | 5.5 | ||
| 2011 | 4.9 | 4.8 | 4.7 | 6.7 | 4.2 | 1.8 | 5.6 | 6.8 | 3.1 | 9.1 | 5.8 | 4.7 | 4.7 | 5.7 | 4.5 | 6.0 | 5.3 | ||
| 2010 | 13.5 | 7.0 | 3.7 | 5.7 | 5.7 | 4.0 | 7.2 | 10.6 | 0.8 | 7.2 | 11.8 | 7.3 | 8.5 | 5.2 | 6.2 | 5.2 | 6.0 | ||
| 2009 | 7.2 | 11.5 | 5.3 | 4.2 | 3.1 | 4.8 | 5.3 | 10.8 | 10.2 | 7.4 | 10.7 | 5.0 | 7.0 | 4.3 | 6.5 | 9.2 | 6.3 | ||
| 2008 | 8.3 | 7.8 | 4.9 | 4.5 | 5.4 | 4.1 | 10.3 | 8.3 | 3.8 | 5.0 | 10.8 | 4.7 | 6.5 | 4.7 | 6.8 | 5.7 | 5.7 | ||
| 2007 | 6.6 | 9.3 | 4.1 | 5.2 | 8.1 | 3.0 | 6.3 | 9.6 | 5.5 | 8.1 | 12.2 | 6.8 | 7.3 | 5.4 | 5.4 | 7.9 | 6.4 | ||
| 2006 | 7.9 | 8.7 | 3.1 | 7.4 | 4.8 | 3.9 | 5.6 | 5.9 | 6.5 | 9.7 | 2.2 | 2.7 | 5.4 | 5.6 | 5.1 | 6.5 | 5.7 | ||
| 2005 | 5.9 | 2.8 | 3.7 | 1.7 | 3.4 | 2.0 | 3.5 | 8.7 | 3.5 | 3.8 | 5.5 | 3.4 | 4.0 | 3.0 | 3.7 | 4.2 | 3.7 | ||
| 2004 | 2.8 | 4.6 | 1.4 | 1.7 | 1.2 | 3.7 | 2.4 | 2.0 | 3.6 | 4.9 | 7.8 | 3.7 | 3.5 | 1.4 | 2.9 | 5.0 | 3.2 | ||
| 2003 | 8.5 | 2.9 | 2.5 | 3.1 | 2.3 | 2.1 | 0.0 | 1.1 | 3.6 | 8.8 | 3.1 | 2.5 | 4.3 | 2.6 | 1.3 | 5.4 | 3.3 | ||
| 2002 | 5.7 | 3.4 | 3.0 | 3.4 | 2.5 | 3.2 | 6.3 | 4.6 | 3.2 | 4.8 | 4.7 | 4.8 | 4.8 | 3.0 | 4.3 | 4.0 | 4.0 | ||
| 2001 | 4.9 | 2.4 | 4.7 | 2.5 | 2.8 | 2.9 | 4.0 | 5.7 | 3.9 | 5.4 | 9.2 | 3.0 | 3.5 | 3.6 | 4.0 | 5.6 | 4.2 | ||
| 2000 | 1.6 | 5.2 | 3.7 | 2.2 | 4.2 | 2.3 | 2.5 | 2.9 | 5.7 | 4.0 | 3.6 | 4.3 | 3.9 | 3.3 | 2.5 | 4.6 | 3.5 | ||
| 1999 | 0.0 | 5.2 | 5.2 | 3.8 | 3.9 | 5.0 | 4.4 | 5.0 | 3.2 | 4.6 | 4.0 | 1.9 | 2.6 | 4.3 | 4.8 | 4.0 | 4.0 | ||
| 1998 | 0.0 | 9.4 | 4.1 | 1.1 | 3.5 | 2.8 | 7.4 | 3.8 | 2.2 | 0.0 | 0.0 | 0.0 | 3.0 | 3.0 | 4.4 | 1.3 | 3.1 | ||
| 1997 | 5.7 | 1.7 | 3.6 | 1.3 | 0.9 | 2.9 | 13.7 | 8.8 | 10.0 | 5.5 | 4.4 | 1.4 | 3.2 | 2.0 | 7.1 | 6.2 | 4.3 | ||
| 1996 | 1.5 | 3.2 | 1.3 | 1.8 | 2.8 | 3.0 | 7.8 | 4.7 | 6.9 | 4.7 | 3.4 | 6.9 | 4.0 | 2.0 | 5.2 | 5.4 | 4.1 | ||
| 1995 | 11.8 | 3.9 | 2.9 | 4.3 | 2.7 | 4.6 | 9.7 | 7.9 | 6.1 | 6.5 | 1.3 | 1.1 | 5.4 | 3.4 | 7.6 | 5.0 | 5.2 | ||
| 1994 | 7.8 | 11.7 | 5.9 | 3.5 | 3.7 | 4.3 | 4.4 | 6.9 | 6.8 | 5.3 | 7.5 | 2.2 | 6.9 | 4.1 | 5.2 | 6.4 | 5.6 | ||
| 1993 | 6.1 | 5.1 | 8.1 | 2.7 | 3.0 | 4.3 | 18.4 | 0.0 | 3.7 | 16.7 | 6.5 | 7.2 | 6.1 | 4.4 | 8.7 | 8.3 | 6.7 | ||
| 1992 | 7.7 | 1.9 | 9.4 | 6.4 | 9.7 | 6.3 | 8.6 | 14.6 | 11.3 | 10.2 | 3.9 | 0.0 | 3.4 | 8.4 | 9.3 | 8.3 | 7.4 | ||
| 1991 | 3.9 | 5.3 | 0.0 | 1.9 | 9.3 | 5.4 | 3.6 | 6.0 | 11.1 | 8.5 | 11.5 | 10.0 | 5.5 | 3.8 | 5.0 | 10.4 | 5.9 | ||
| 1990 | 15.5 | 13.0 | 5.4 | 8.2 | 5.6 | 11.1 | 6.9 | 2.8 | 12.5 | 10.7 | 9.6 | 6.6 | 12.7 | 6.4 | 7.0 | 11.0 | 9.7 | ||
| 1989 | 15.8 | 12.1 | 14.4 | 12.3 | 8.1 | 12.6 | 14.4 | 11.3 | 11.7 | 12.8 | 15.8 | 12.5 | 13.4 | 11.8 | 12.7 | 13.3 | 12.8 | ||
| 1988 | 13.8 | 13.1 | 14.0 | 12.1 | 6.6 | 7.7 | 6.5 | 15.4 | 11.4 | 9.6 | 9.1 | 13.5 | 13.4 | 10.4 | 9.7 | 10.1 | 11.0 | ||
| 1987 | 0.0 | 6.7 | 8.9 | 5.9 | 7.2 | 3.8 | 10.3 | 8.3 | 12.4 | 14.8 | 8.7 | 7.8 | 7.4 | 7.3 | 7.4 | 12.0 | 8.7 | ||
| 1986 | 11.5 | 2.6 | 7.5 | 11.1 | 12.8 | 2.9 | 17.4 | 5.6 | 6.5 | 29.4 | 20.7 | 11.4 | 8.1 | 10.3 | 7.5 | 20.7 | 11.8 | ||
| 1985 | 0.0 | 0.0 | 0.0 | 2.3 | 1.8 | 0.0 | 12.5 | 5.9 | 9.1 | 5.3 | 0.0 | 10.7 | 3.4 | 1.5 | 2.4 | 5.0 | 2.5 | ||
| 1984 | 0.0 | 0.0 | 20.0 | 0.0 | 0.0 | 0.0 | 0.0 | 0.0 | 0.0 | 0.0 | 0.0 | 0.0 | 0.0 | 4.8 | 0.0 | 0.0 | 0.4 | ||
| 1983 | 0.0 | 0.0 | 0.0 | 7.7 | 0.0 | 0.0 | 0.0 | 0.0 | 0.0 | - | 0.0 | 0.0 | 0.0 | 3.7 | 0.0 | 0.0 | 1.0 | ||
| 1982 | - | 0.0 | - | 0.0 | 0.0 | 0.0 | - | 0.0 | - | 0.0 | - | 0.0 | 0.0 | 0.0 | 0.0 | 0.0 | 0.0 | ||
Breeding data
Breeding records by month
Number of breeding records by breeding code and month, 2017 and all years| Breeding code | Jul | Aug | Sep | Oct | Nov | Dec | Jan | Feb | Mar | Apr | May | Jun |
|---|---|---|---|---|---|---|---|---|---|---|---|---|
| 2017 | ||||||||||||
| Breeding (BLA code) | 0 | 0 | 0 | 1 | 0 | 0 | 0 | 0 | 0 | 0 | 2 | 0 |
| Carrying Food | 0 | 0 | 0 | 0 | 0 | 0 | 0 | 0 | 0 | 0 | 0 | 0 |
| Copulating | 0 | 0 | 0 | 0 | 0 | 0 | 0 | 0 | 0 | 0 | 0 | 0 |
| Display | 0 | 0 | 0 | 1 | 0 | 0 | 0 | 0 | 0 | 0 | 0 | 0 |
| Dependent young | 0 | 0 | 0 | 0 | 0 | 0 | 0 | 0 | 0 | 0 | 0 | 0 |
| Faecal sac | 0 | 0 | 0 | 0 | 0 | 0 | 0 | 0 | 0 | 0 | 0 | 0 |
| Inspecting hollow | 0 | 0 | 0 | 0 | 0 | 0 | 0 | 0 | 0 | 0 | 0 | 0 |
| Nest building | 0 | 0 | 0 | 0 | 0 | 0 | 0 | 0 | 0 | 0 | 0 | 0 |
| Nest with eggs | 0 | 0 | 0 | 0 | 0 | 0 | 0 | 0 | 0 | 0 | 0 | 0 |
| Nest with young | 0 | 0 | 0 | 0 | 0 | 0 | 0 | 0 | 0 | 0 | 0 | 0 |
| On/leaving nest | 0 | 0 | 0 | 1 | 0 | 0 | 0 | 0 | 0 | 0 | 0 | 0 |
| All years | ||||||||||||
| Breeding (BLA code) | 0 | 0 | 0 | 2 | 2 | 0 | 1 | 1 | 0 | 0 | 2 | 0 |
| Carrying Food | 0 | 0 | 0 | 0 | 0 | 0 | 0 | 0 | 0 | 0 | 0 | 0 |
| Copulating | 0 | 0 | 0 | 1 | 0 | 0 | 0 | 0 | 0 | 0 | 1 | 0 |
| Display | 1 | 0 | 2 | 3 | 0 | 1 | 0 | 0 | 0 | 1 | 2 | 0 |
| Dependent young | 0 | 0 | 0 | 0 | 1 | 2 | 1 | 1 | 3 | 0 | 0 | 0 |
| Faecal sac | 0 | 0 | 0 | 0 | 0 | 0 | 0 | 0 | 0 | 0 | 0 | 0 |
| Inspecting hollow | 0 | 0 | 0 | 0 | 0 | 0 | 0 | 0 | 0 | 0 | 0 | 0 |
| Nest building | 1 | 6 | 2 | 0 | 0 | 0 | 0 | 0 | 0 | 0 | 1 | 0 |
| Nest with eggs | 0 | 1 | 0 | 0 | 4 | 0 | 0 | 0 | 0 | 0 | 0 | 0 |
| Nest with young | 1 | 2 | 8 | 11 | 5 | 0 | 0 | 1 | 0 | 0 | 0 | 0 |
| On/leaving nest | 0 | 4 | 1 | 2 | 2 | 0 | 0 | 0 | 0 | 0 | 0 | 0 |
Breeding records by year
Average number of breeding records per period by breeding code| Period | Breeding (BLA code) | Carrying Food | Copulating | Display | Dependent young | Faecal sac | Inspecting hollow | Nest building | Nest with eggs | Nest with young | On/leaving nest |
|---|---|---|---|---|---|---|---|---|---|---|---|
| All years | |||||||||||
| All | 0.2 | 0.0 | 0.1 | 0.3 | 0.2 | 0.0 | 0.0 | 0.3 | 0.1 | 0.8 | 0.2 |
| Previous years | |||||||||||
| All previous years | 0.1 | 0.0 | 0.1 | 0.3 | 0.2 | 0.0 | 0.0 | 0.3 | 0.1 | 0.8 | 0.2 |
| Previous 30 years | 0.2 | 0.0 | 0.1 | 0.3 | 0.3 | 0.0 | 0.0 | 0.3 | 0.2 | 0.9 | 0.3 |
| Previous 20 years | 0.2 | 0.0 | 0.1 | 0.4 | 0.2 | 0.0 | 0.0 | 0.1 | 0.0 | 0.5 | 0.3 |
| 10 year groups | |||||||||||
| [2007,2017) | 0.2 | 0.0 | 0.2 | 0.7 | 0.5 | 0.0 | 0.0 | 0.1 | 0.1 | 0.6 | 0.5 |
| [1997,2007) | 0.3 | 0.0 | 0.0 | 0.1 | 0.0 | 0.0 | 0.0 | 0.1 | 0.0 | 0.4 | 0.1 |
| [1987,1997) | 0.0 | 0.0 | 0.0 | 0.1 | 0.3 | 0.0 | 0.0 | 0.8 | 0.4 | 1.8 | 0.2 |
| 5 year groups | |||||||||||
| [2012,2017) | 0.0 | 0.0 | 0.0 | 1.4 | 0.6 | 0.0 | 0.0 | 0.0 | 0.2 | 0.6 | 0.6 |
| [2007,2012) | 0.4 | 0.0 | 0.4 | 0.0 | 0.4 | 0.0 | 0.0 | 0.2 | 0.0 | 0.6 | 0.4 |
| [2002,2007) | 0.0 | 0.0 | 0.0 | 0.0 | 0.0 | 0.0 | 0.0 | 0.2 | 0.0 | 0.0 | 0.0 |
| [1997,2002) | 0.6 | 0.0 | 0.0 | 0.2 | 0.0 | 0.0 | 0.0 | 0.0 | 0.0 | 0.8 | 0.2 |
| [1992,1997) | 0.0 | 0.0 | 0.0 | 0.2 | 0.2 | 0.0 | 0.0 | 0.0 | 0.0 | 0.4 | 0.2 |
| [1987,1992) | 0.0 | 0.0 | 0.0 | 0.0 | 0.4 | 0.0 | 0.0 | 1.6 | 0.8 | 3.2 | 0.2 |
| Year | |||||||||||
| 2017 | 3.0 | 0.0 | 0.0 | 1.0 | 0.0 | 0.0 | 0.0 | 0.0 | 0.0 | 0.0 | 1.0 |
| 2016 | 0.0 | 0.0 | 0.0 | 2.0 | 2.0 | 0.0 | 0.0 | 0.0 | 0.0 | 0.0 | 0.0 |
| 2015 | 0.0 | 0.0 | 0.0 | 2.0 | 1.0 | 0.0 | 0.0 | 0.0 | 0.0 | 1.0 | 0.0 |
| 2014 | 0.0 | 0.0 | 0.0 | 2.0 | 0.0 | 0.0 | 0.0 | 0.0 | 0.0 | 0.0 | 1.0 |
| 2013 | 0.0 | 0.0 | 0.0 | 1.0 | 0.0 | 0.0 | 0.0 | 0.0 | 0.0 | 2.0 | 0.0 |
| 2012 | 0.0 | 0.0 | 0.0 | 0.0 | 0.0 | 0.0 | 0.0 | 0.0 | 1.0 | 0.0 | 2.0 |
| 2011 | 0.0 | 0.0 | 1.0 | 0.0 | 0.0 | 0.0 | 0.0 | 0.0 | 0.0 | 0.0 | 0.0 |
| 2010 | 0.0 | 0.0 | 0.0 | 0.0 | 0.0 | 0.0 | 0.0 | 1.0 | 0.0 | 3.0 | 1.0 |
| 2009 | 1.0 | 0.0 | 1.0 | 0.0 | 0.0 | 0.0 | 0.0 | 0.0 | 0.0 | 0.0 | 0.0 |
| 2008 | 1.0 | 0.0 | 0.0 | 0.0 | 0.0 | 0.0 | 0.0 | 0.0 | 0.0 | 0.0 | 1.0 |
| 2007 | 0.0 | 0.0 | 0.0 | 0.0 | 2.0 | 0.0 | 0.0 | 0.0 | 0.0 | 0.0 | 0.0 |
| 2006 | 0.0 | 0.0 | 0.0 | 0.0 | 0.0 | 0.0 | 0.0 | 0.0 | 0.0 | 0.0 | 0.0 |
| 2005 | 0.0 | 0.0 | 0.0 | 0.0 | 0.0 | 0.0 | 0.0 | 0.0 | 0.0 | 0.0 | 0.0 |
| 2004 | 0.0 | 0.0 | 0.0 | 0.0 | 0.0 | 0.0 | 0.0 | 1.0 | 0.0 | 0.0 | 0.0 |
| 2003 | 0.0 | 0.0 | 0.0 | 0.0 | 0.0 | 0.0 | 0.0 | 0.0 | 0.0 | 0.0 | 0.0 |
| 2002 | 0.0 | 0.0 | 0.0 | 0.0 | 0.0 | 0.0 | 0.0 | 0.0 | 0.0 | 0.0 | 0.0 |
| 2001 | 1.0 | 0.0 | 0.0 | 1.0 | 0.0 | 0.0 | 0.0 | 0.0 | 0.0 | 1.0 | 0.0 |
| 2000 | 1.0 | 0.0 | 0.0 | 0.0 | 0.0 | 0.0 | 0.0 | 0.0 | 0.0 | 1.0 | 0.0 |
| 1999 | 1.0 | 0.0 | 0.0 | 0.0 | 0.0 | 0.0 | 0.0 | 0.0 | 0.0 | 0.0 | 1.0 |
| 1998 | 0.0 | 0.0 | 0.0 | 0.0 | 0.0 | 0.0 | 0.0 | 0.0 | 0.0 | 2.0 | 0.0 |
| 1997 | 0.0 | 0.0 | 0.0 | 0.0 | 0.0 | 0.0 | 0.0 | 0.0 | 0.0 | 0.0 | 0.0 |
| 1996 | 0.0 | 0.0 | 0.0 | 0.0 | 0.0 | 0.0 | 0.0 | 0.0 | 0.0 | 0.0 | 0.0 |
| 1995 | 0.0 | 0.0 | 0.0 | 0.0 | 0.0 | 0.0 | 0.0 | 0.0 | 0.0 | 0.0 | 0.0 |
| 1994 | 0.0 | 0.0 | 0.0 | 0.0 | 1.0 | 0.0 | 0.0 | 0.0 | 0.0 | 2.0 | 0.0 |
| 1993 | 0.0 | 0.0 | 0.0 | 0.0 | 0.0 | 0.0 | 0.0 | 0.0 | 0.0 | 0.0 | 1.0 |
| 1992 | 0.0 | 0.0 | 0.0 | 1.0 | 0.0 | 0.0 | 0.0 | 0.0 | 0.0 | 0.0 | 0.0 |
| 1991 | 0.0 | 0.0 | 0.0 | 0.0 | 0.0 | 0.0 | 0.0 | 0.0 | 0.0 | 1.0 | 1.0 |
| 1990 | 0.0 | 0.0 | 0.0 | 0.0 | 0.0 | 0.0 | 0.0 | 0.0 | 0.0 | 0.0 | 0.0 |
| 1989 | 0.0 | 0.0 | 0.0 | 0.0 | 0.0 | 0.0 | 0.0 | 1.0 | 0.0 | 0.0 | 0.0 |
| 1988 | 0.0 | 0.0 | 0.0 | 0.0 | 2.0 | 0.0 | 0.0 | 7.0 | 1.0 | 13.0 | 0.0 |
| 1987 | 0.0 | 0.0 | 0.0 | 0.0 | 0.0 | 0.0 | 0.0 | 0.0 | 3.0 | 2.0 | 0.0 |
| 1986 | 0.0 | 0.0 | 0.0 | 0.0 | 0.0 | 0.0 | 0.0 | 0.0 | 0.0 | 0.0 | 0.0 |
| 1985 | 0.0 | 0.0 | 0.0 | 0.0 | 0.0 | 0.0 | 0.0 | 0.0 | 0.0 | 0.0 | 0.0 |
| 1984 | 0.0 | 0.0 | 0.0 | 0.0 | 0.0 | 0.0 | 0.0 | 0.0 | 0.0 | 0.0 | 0.0 |
| 1983 | 0.0 | 0.0 | 0.0 | 0.0 | 0.0 | 0.0 | 0.0 | 0.0 | 0.0 | 0.0 | 0.0 |
| 1982 | 0.0 | 0.0 | 0.0 | 0.0 | 0.0 | 0.0 | 0.0 | 0.0 | 0.0 | 0.0 | 0.0 |
Distribution map
Distribution - 2017
This map shows the observed distribution of the Wedge-tailed Eagle for 2017.
The red circles are the grid cells where Wedge-tailed Eagle have been reported.
The transparency of the red circles indicate how many surveys sheets were submitted for that grid cell; the darker the red the more reliable the data. Of the 315 grid cells with reports, 83 had only one sheet; an example is grid number B1.
The size of the circle represents the reporting rate. The maximum reporting rate for Wedge-tailed Eagle was 100.0% (eg grid number B1) and the minimum was 0.1% (eg grid number J14). 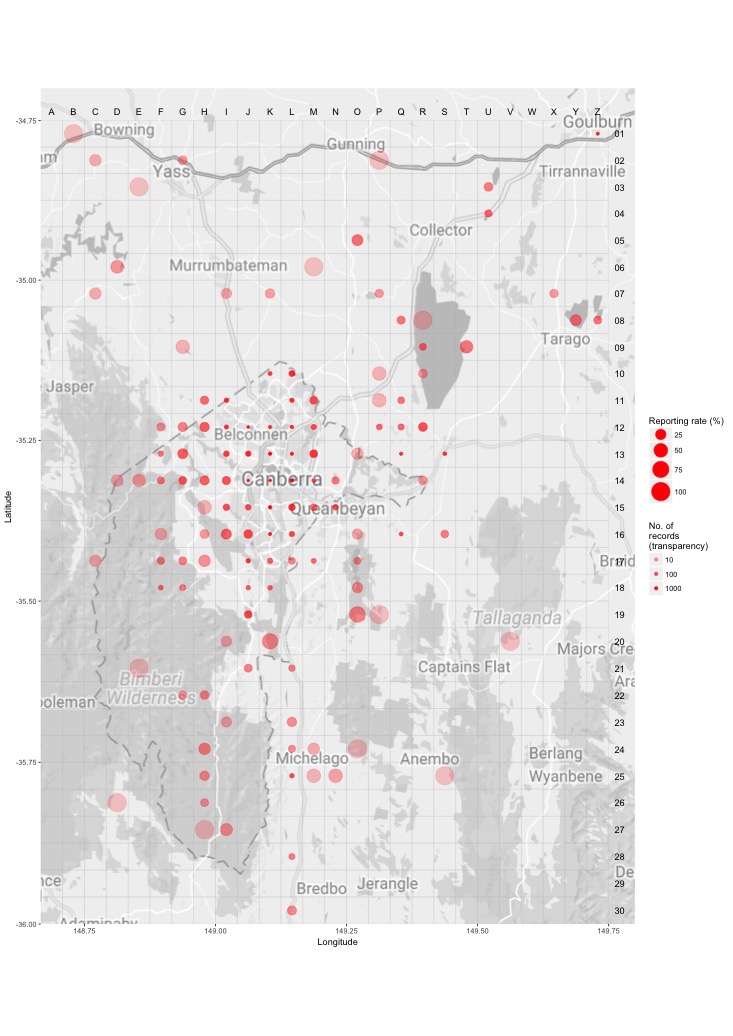
Distribution - all years
This map shows the observed distribution of the Wedge-tailed Eagle for all years.
The red circles are the grid cells where Wedge-tailed Eagle have been reported.
The transparency of the red circles indicate how many surveys sheets were submitted for that grid cell; the darker the red the more reliable the data. Of the 703 grid cells with reports, 55 had only one sheet; an example is grid number B2.
The size of the circle represents the reporting rate. The maximum reporting rate for Wedge-tailed Eagle was 100.0% (eg grid number B2) and the minimum was 0.2% (eg grid number Z1). 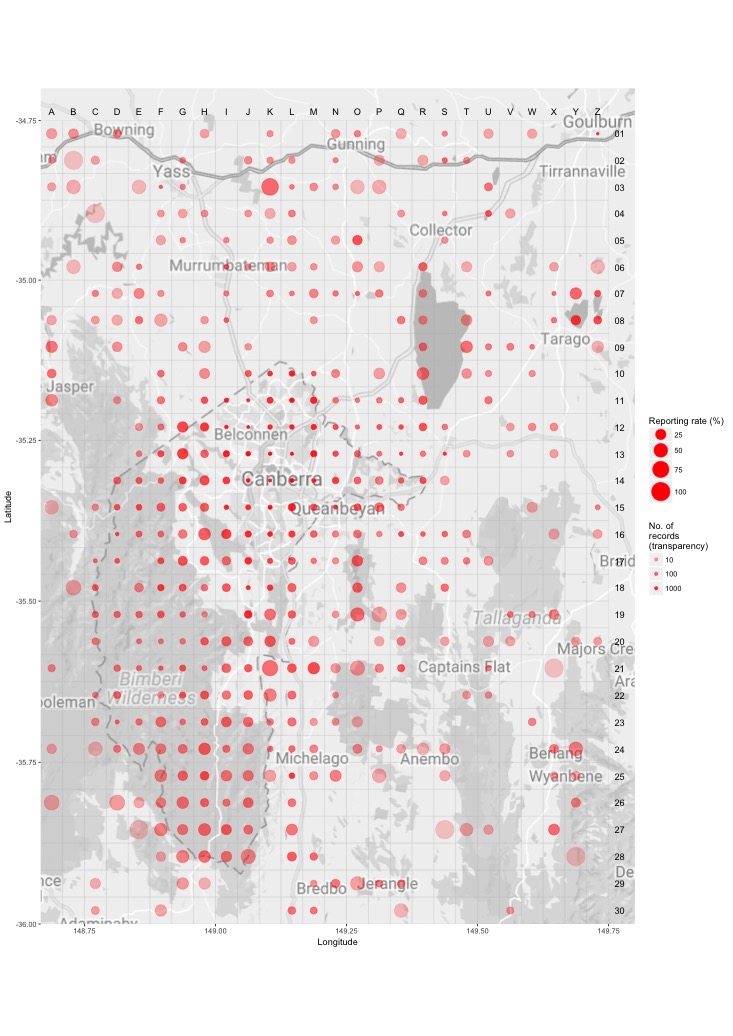
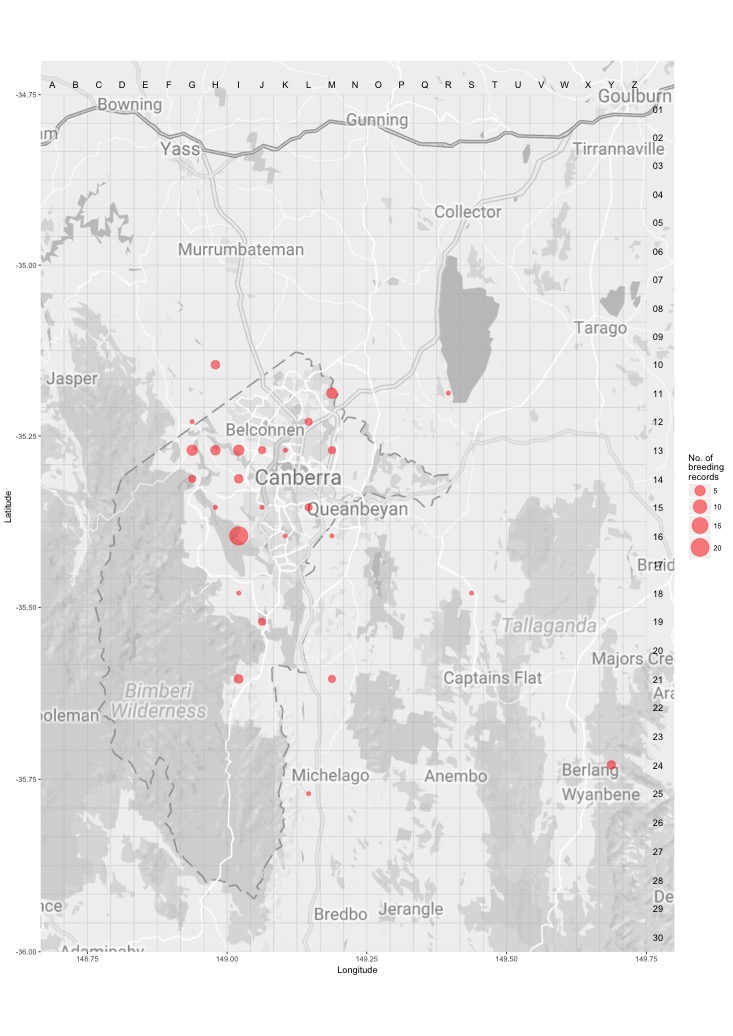
Breeding map
Breeding - 2017
This map shows the breeding distribution of the Wedge-tailed Eagle for 2017.
The red circles are the grid cells where breeding activity for Wedge-tailed Eagle have been reported.
The size of the circle represents the number of reports. 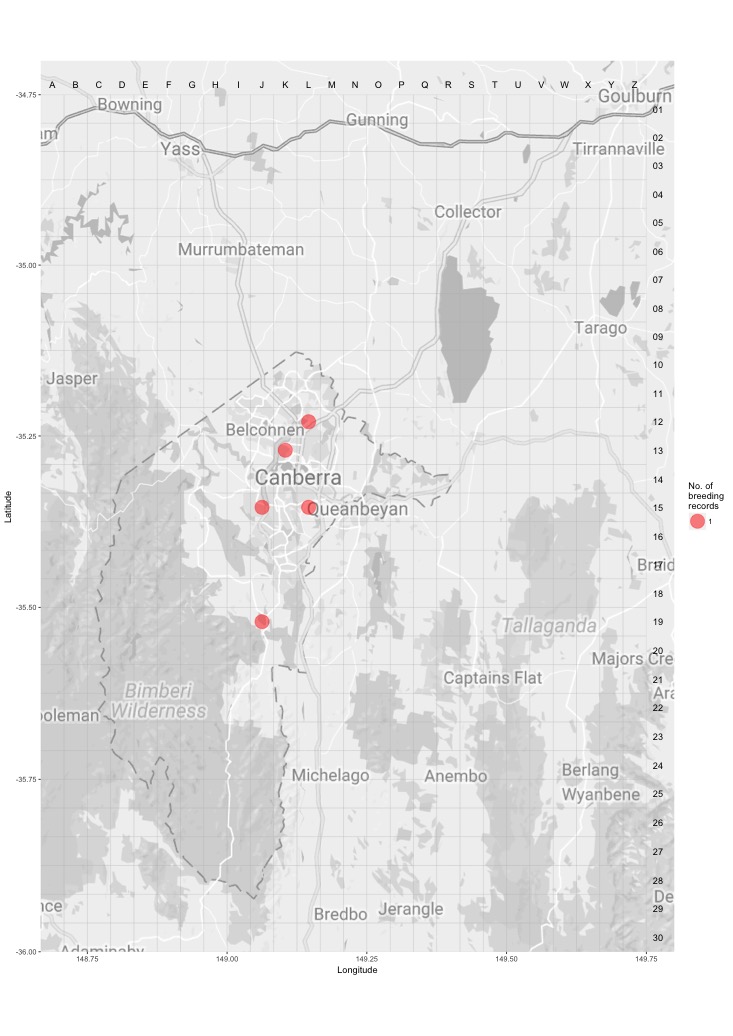
Breeding - all years
This map shows the breeding distribution of the Wedge-tailed Eagle for all years.
The red circles are the grid cells where breeding activity for Wedge-tailed Eagle have been reported.
The size of the circle represents the number of reports.